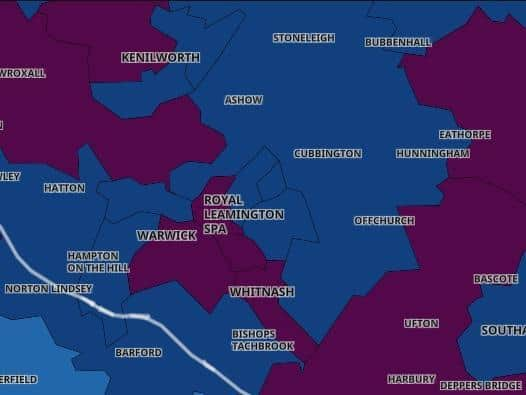
Here's a breakdown of the latest Covid figures for the individual areas in and around Leamington, Warwick and Kenilworth
and live on Freeview channel 276
The Warwick district saw a 25 per cent increase in Covid cases - but the district is is still under the national average.
The ward of Leamington West and Milverton now has the highest Covid rate per 100,000 people in the Warwick district.
Advertisement
Hide AdAdvertisement
Hide AdAll areas of the district are still below the national average apart from Leamington West and Milverton, which has a rolling rate of 538.8 positive cases per 100,000 people.


The figures are based on Government figures for the seven days up to January 6.
Overall, the Warwick district still has a relatively low rate - 383.3 per 100,000 people - but the numbers increased by 25 per cent as we enter the second week of the latest lockdown.
The largest percentage increases were in Kenilworth South (76.9%) and Whitnash (71%).
Here are the figures for the individual areas.
The figures cover the seven days up to January 6.
Advertisement
Hide AdAdvertisement
Hide AdSeven day rates are expressed per 100,000 population and are calculated by dividing the seven day count by the area population and multiplying by 100,000.
OVERALL
Warwick district
Seven days to 06 January 2021
Total cases: 551
The rate has increased relative to the previous week by 112 (25.5%)
Rolling rate: 383.3
Warwickshire
Total cases: 2,385
The rate has increased relative to the previous week by 366 (18.1%)
Rolling rate: 412.7
LEAMINGTON, LILLINGTON AND WHITNASH
Leamington East & Sydenham
Total cases: 36
The rate has increased relative to the previous week by 2 (5.9%)
Rolling rate: 324.9
Leamington Central & North
Total cases: 48
Advertisement
Hide AdAdvertisement
Hide AdThe rate has increased relative to the previous week by 17 (54.8%)
Rolling rate: 350.9
Leamington West & Milverton
Total cases: 52
The rate has increased relative to the previous week by 9 (20.9%)
Rolling rate: 538.8 (above the national average)
Leamington Brunswick
Total cases: 44
The rate has increased relative to the previous week by 16 (57.1%)
Rolling rate: 402.3
Lillington
Total cases: 19
The rate has increased relative to the previous week by 2 (11.8%)
Rolling rate: 346.8
Whitnash
Total cases: 53
Advertisement
Hide AdAdvertisement
Hide AdThe rate has increased relative to the previous week by 22 (71.0%)
Rolling rate: 540.0
WARWICK
Warwick South East, Myton & Heathcote
Total cases: 49
The rate has decreased relative to the previous week by 1 (-2.0%)
Rolling rate: 421.3
Warwick South West & Aylesford
Total cases: 40
The rate has increased relative to the previous week by 4 (11.1%)
Rolling rate: 317.8
Warwick North
Total cases: 23
The rate has increased relative to the previous week by 1 (4.5%)
Rolling rate: 273.5
KENILWORTH
Kenilworth West
Total cases: 31
Advertisement
Hide AdAdvertisement
Hide AdThe rate has increased relative to the previous week by 7 (29.2%)
Rolling rate: 416.2
Kenilworth East
Total cases: 30
The rate has increased relative to the previous week by 6 (25.0%)
Rolling rate: 373.8
Kenilworth South
Total cases: 23
The rate has increased relative to the previous week by 10 (76.9%)
Rolling rate: 322.1
RURAL AREAS
Cubbington, Stoneleigh & Radford Semele
Total cases: 42
The rate has increased relative to the previous week by 13 (44.8%)
Rolling rate: 324.9
Bishops Tachbrook, Barford & Hatton Park
Total cases: 33
Advertisement
Hide AdAdvertisement
Hide AdThe rate has increased relative to the previous week by 8 (32.0%)
Rolling rate: 339.9
Wellesbourne & Snitterfield
Total cases: 16
The rate has decreased relative to the previous week by 7 (-30.4%)
Rolling rate: 160.1
Henley-in-Arden & Claverdon
Total cases: 37
The rate has increased relative to the previous week by 4 (12.1%)
Rolling rate: 545.7 (above the national average)
Kingswood & Leek Wootton
Total cases: 28
The rate has decreased relative to the previous week by 4 (-12.5%)
Rolling rate: 534.4
Balsall Common
Total cases: 21
The rate has increased relative to the previous week by 5 (31.2%)
Rolling rate: 251.3