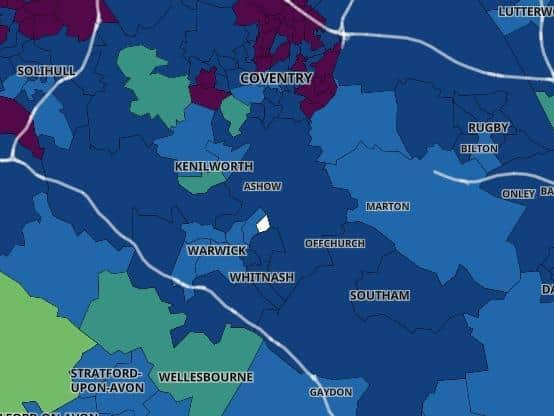
Latest Covid figures show the effects of lockdown on Leamington, Warwick and Kenilworth
and live on Freeview channel 276
The Warwick district has seen a big drop in positive Covid cases, according to the latest data.
In the seven days up to January 26, there was a 38% reduction in cases as the lockdown continues to have an impact.
Advertisement
Hide AdAdvertisement
Hide AdThis means that it now has a rolling rate of 185 per 100,000 people - its lowest rate for many weeks.


Seven–day rolling rates are expressed per 100,000 population and are calculated by dividing the seven day count by the area population and multiplying by 100,000
The Warwick district has the second lowest rate in the county, with Stratford recording a rolling rate of 153 per 100,000 people.
The individual wards in the Warwick district are continuing the fall - and with vaccinations continuing to increase, there is much for residents to look forward to.
Advertisement
Hide AdAdvertisement
Hide AdBut health chiefs are urging people to remain cautious and stick to the rules in the weeks ahead.
Kenilworth South saw a 75% drop in Covid cases (from 16 to just 4 to the seven days to January 26) and it now has the lowest rolling rate in the district - 56 cases per 100,000 people.
The whole of Warwickshire has seen a fall of 27%, with a rolling rate of 245.7.
Here are the figures of the various boroughs and districts in the county, for the seven days to January 26:
Advertisement
Hide AdAdvertisement
Hide Ad(Seven–day rates are expressed per 100,000 population and are calculated by dividing the seven day count by the area population and multiplying by 100,000).
Stratford-on-Avon
Total cases: 199
The rate has decreased relative to the previous week by 132 (-39.9%)
Rolling rate: 153.0 (below the national average)
Warwick
Total cases: 266
The rate has decreased relative to the previous week by 163 (-38.0%)
Rolling rate: 185.0 (below the national average)
Rugby
Total cases: 299
The rate has decreased relative to the previous week by 96 (-24.3%)
Rolling rate: 274.5 (just above the national average)
Nuneaton and Bedworth
Total cases: 420
Advertisement
Hide AdAdvertisement
Hide AdThe rate has decreased relative to the previous week by 93 (-18.1%)
Rolling rate: 323.4 (above the national average)
North Warwickshire
Total cases: 236
The rate has decreased relative to the previous week by 40 (-14.5%)
Rolling rate: 361.6 (above the national average)
Warwickshire (overall)
Total cases: 1,420
The rate has decreased relative to the previous week by 524 (-27.0%)
Rolling rate: 245.7 (the national average)